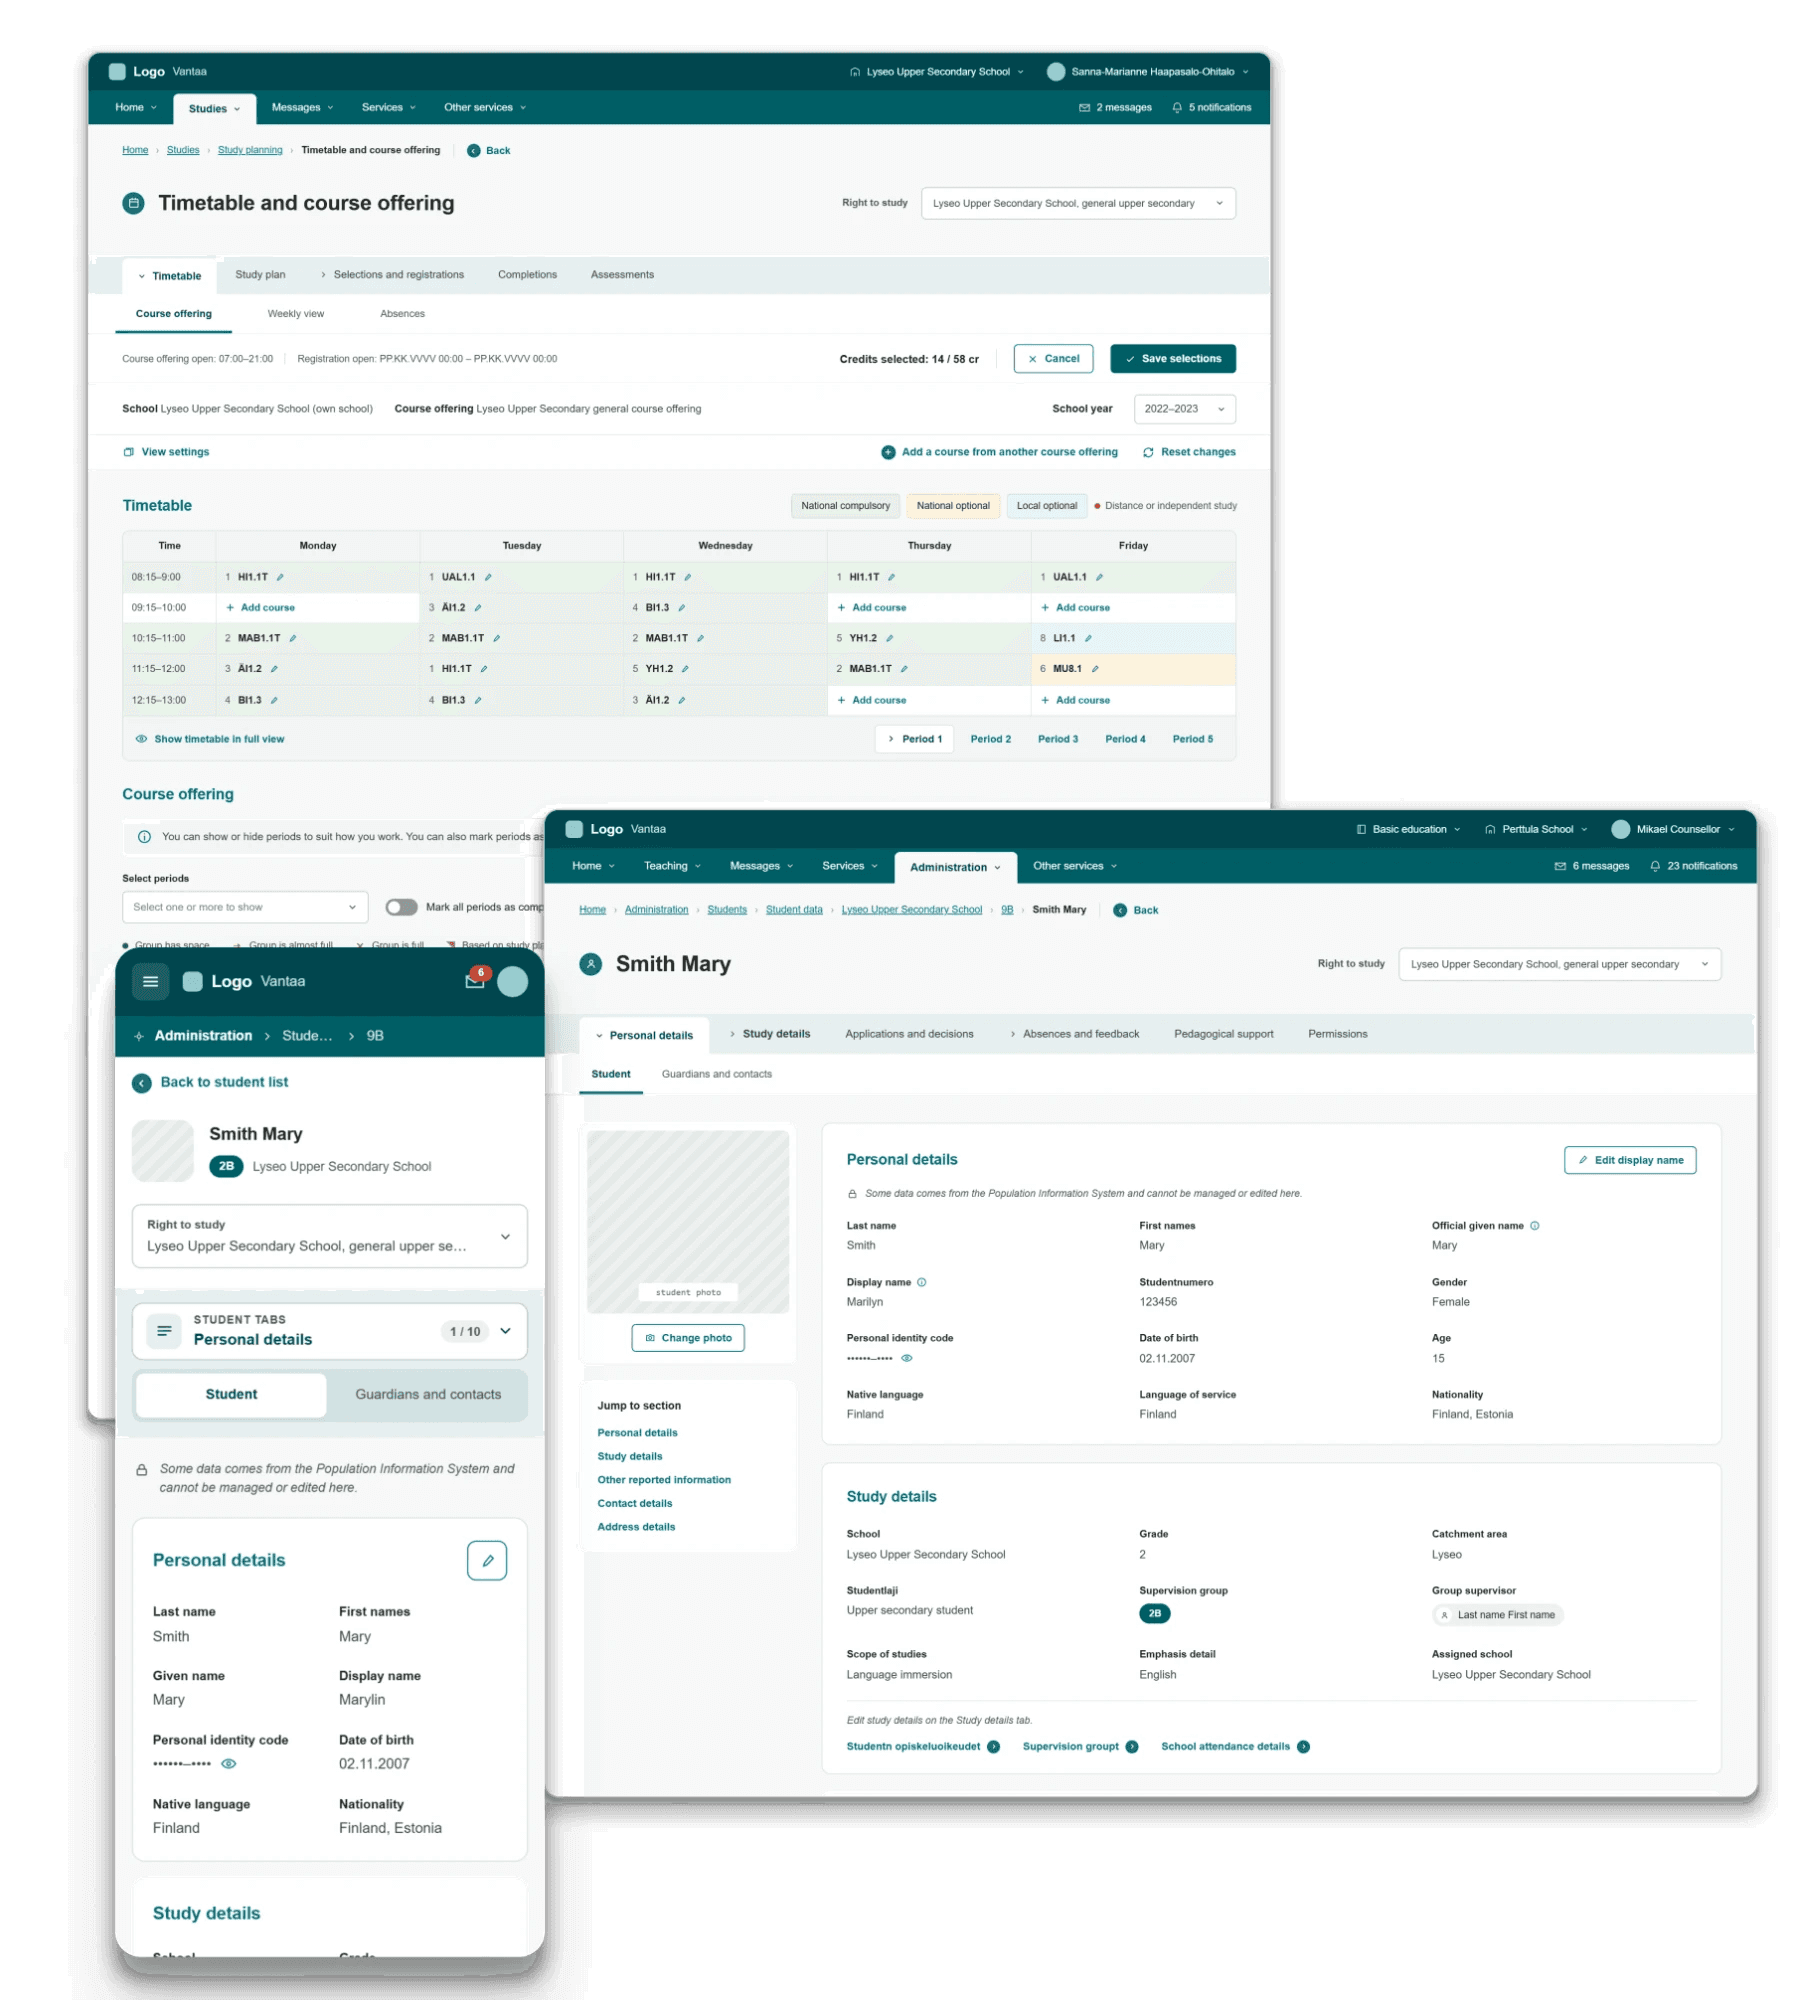
 Public education
National Education Administration Platform
Brought structure to a massive public sector platform by uniting complex municipal school workflows into a clear, accessible tool for teachers and administrators.
View case study →Case study · Industrial Data & Expert Interface Design
Industrial PlatformA platform for monitoring, calculation, reporting and statistical analysis, used by specialists both internally and by customers. I redesigned the expert experience in many ways, from dashboards to data views.
Role: UX Designer (sole designer on the project)
Focus: Expert tools, data visualization, and Design System modernization
The brief
An industrial platform for monitoring and reporting had grown complex over time, with expert users struggling through long text lists and manual calculations. I joined as the sole designer, taking over from a previous one, to make the tool work the way specialists actually needed it to.
Selected screens
Desktop and mobile, one platform
Results
After launching new features, we systematically ran feedback and testing sessions with actual users. This continuous loop helped us validate what worked in daily operations, identify areas for refinement, and keep the product evolving based on real user needs.
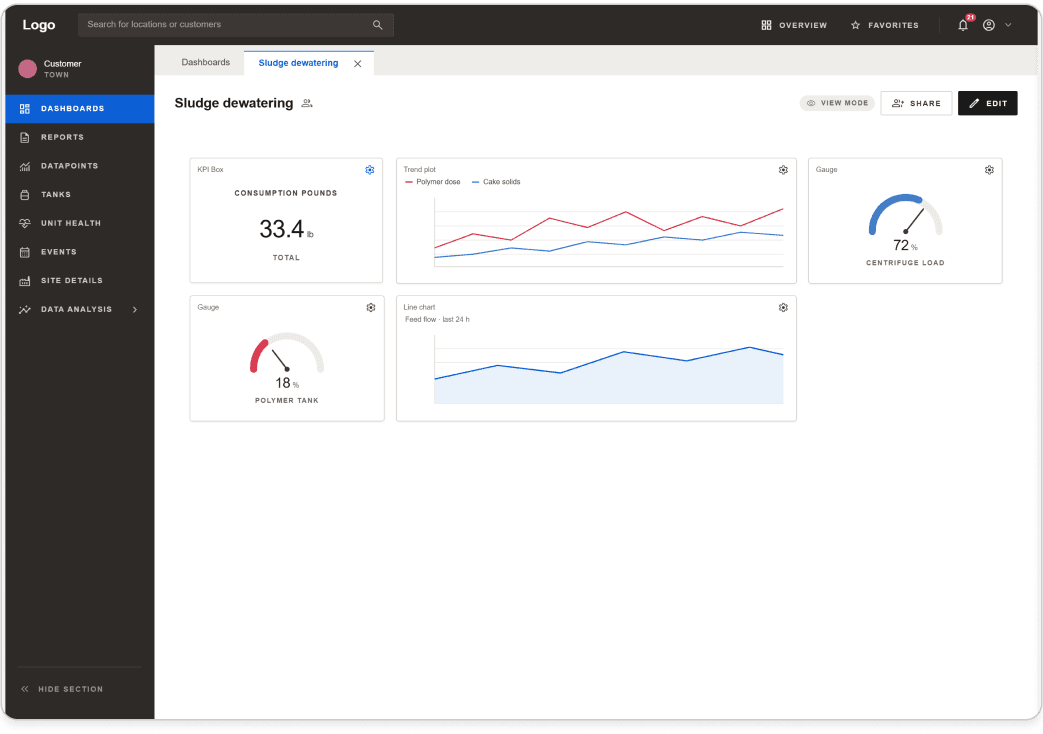
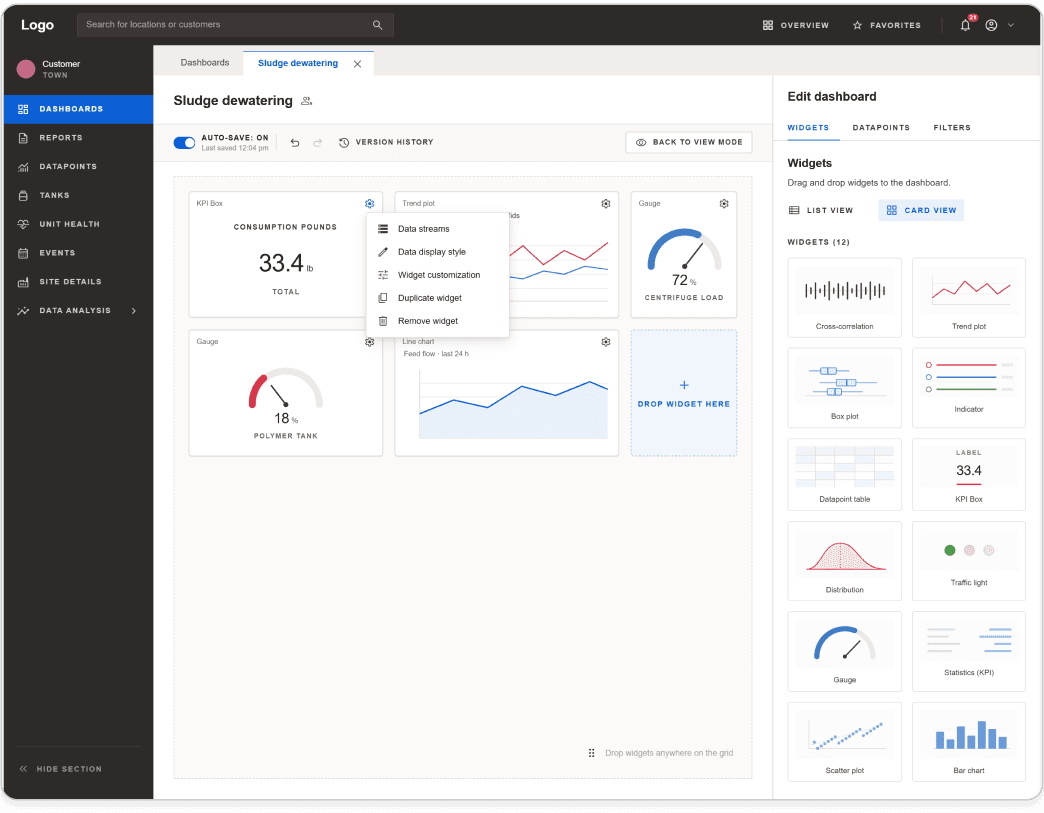
Turning the dashboard's data panels into visual cards meant specialists no longer had to read through long text lists to find what they needed. Information that used to take scanning and interpreting now became something they could understand in seconds, directly speeding up their daily monitoring and reporting work.
Before this, running a complex calculation required deep expertise and careful manual work. The new calculation window guided specialists through the process step by step, reducing the risk of errors and making it possible for more people on the team to run these calculations confidently, not just the most experienced ones.
Adding auto-save to data and reporting views removed a real, everyday frustration: losing work due to a missed save or a dropped connection, something that mattered a lot to users working with time-sensitive data from remote factory locations.
Migrating the Design System from Sketch to Figma didn't just modernize the tool, it meant developers and designers were finally working in the same environment. That made handing designs over faster and reduced the back-and-forth that came from working across two disconnected design tools, freeing up time developers had previously spent interpreting or translating designs between formats. I received direct, positive feedback from both the developers and the project manager, who noted how much smoother their day-to-day work became as a result.
Background
I stepped into an ongoing project, picking up work from a previous designer. Some of the first things I focused on were visual improvements to the interface, for example turning the small panels on the dashboard into visual cards instead of plain text lists, which made them much easier to read at a glance. From there, we also designed an auto-save feature for data and reporting views, and improved the structure and content of reports.
The hard parts
In hindsight
Keep reading
Public educationBrought structure to a massive public sector platform by uniting complex municipal school workflows into a clear, accessible tool for teachers and administrators.
View case study →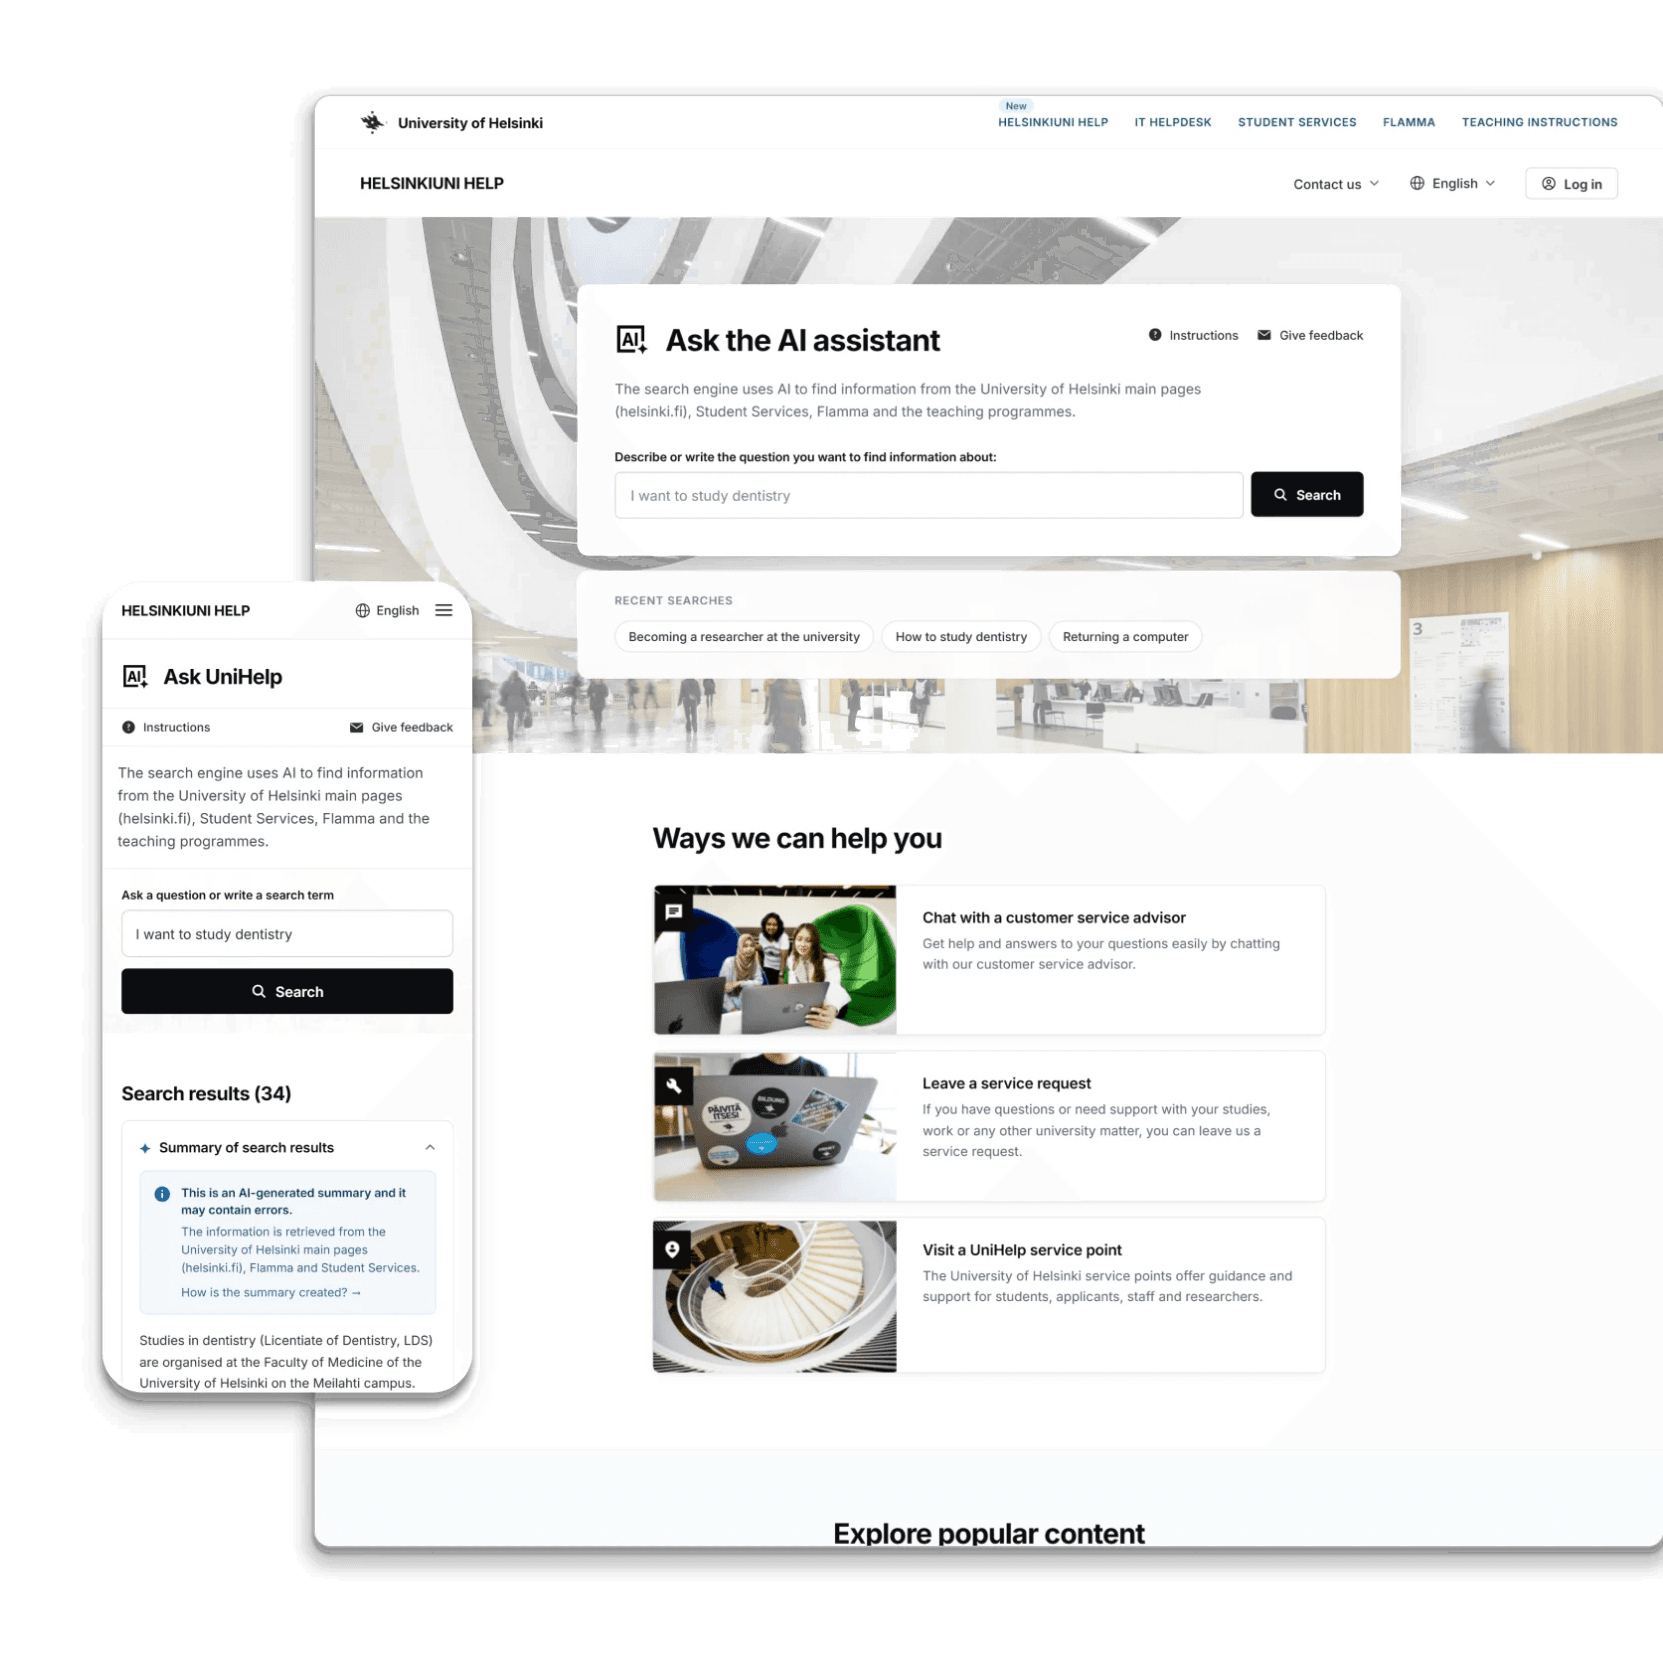 Higher education
Designed a smarter search and service hub so students can find guidance and support without getting lost in fragmented systems.
View case study →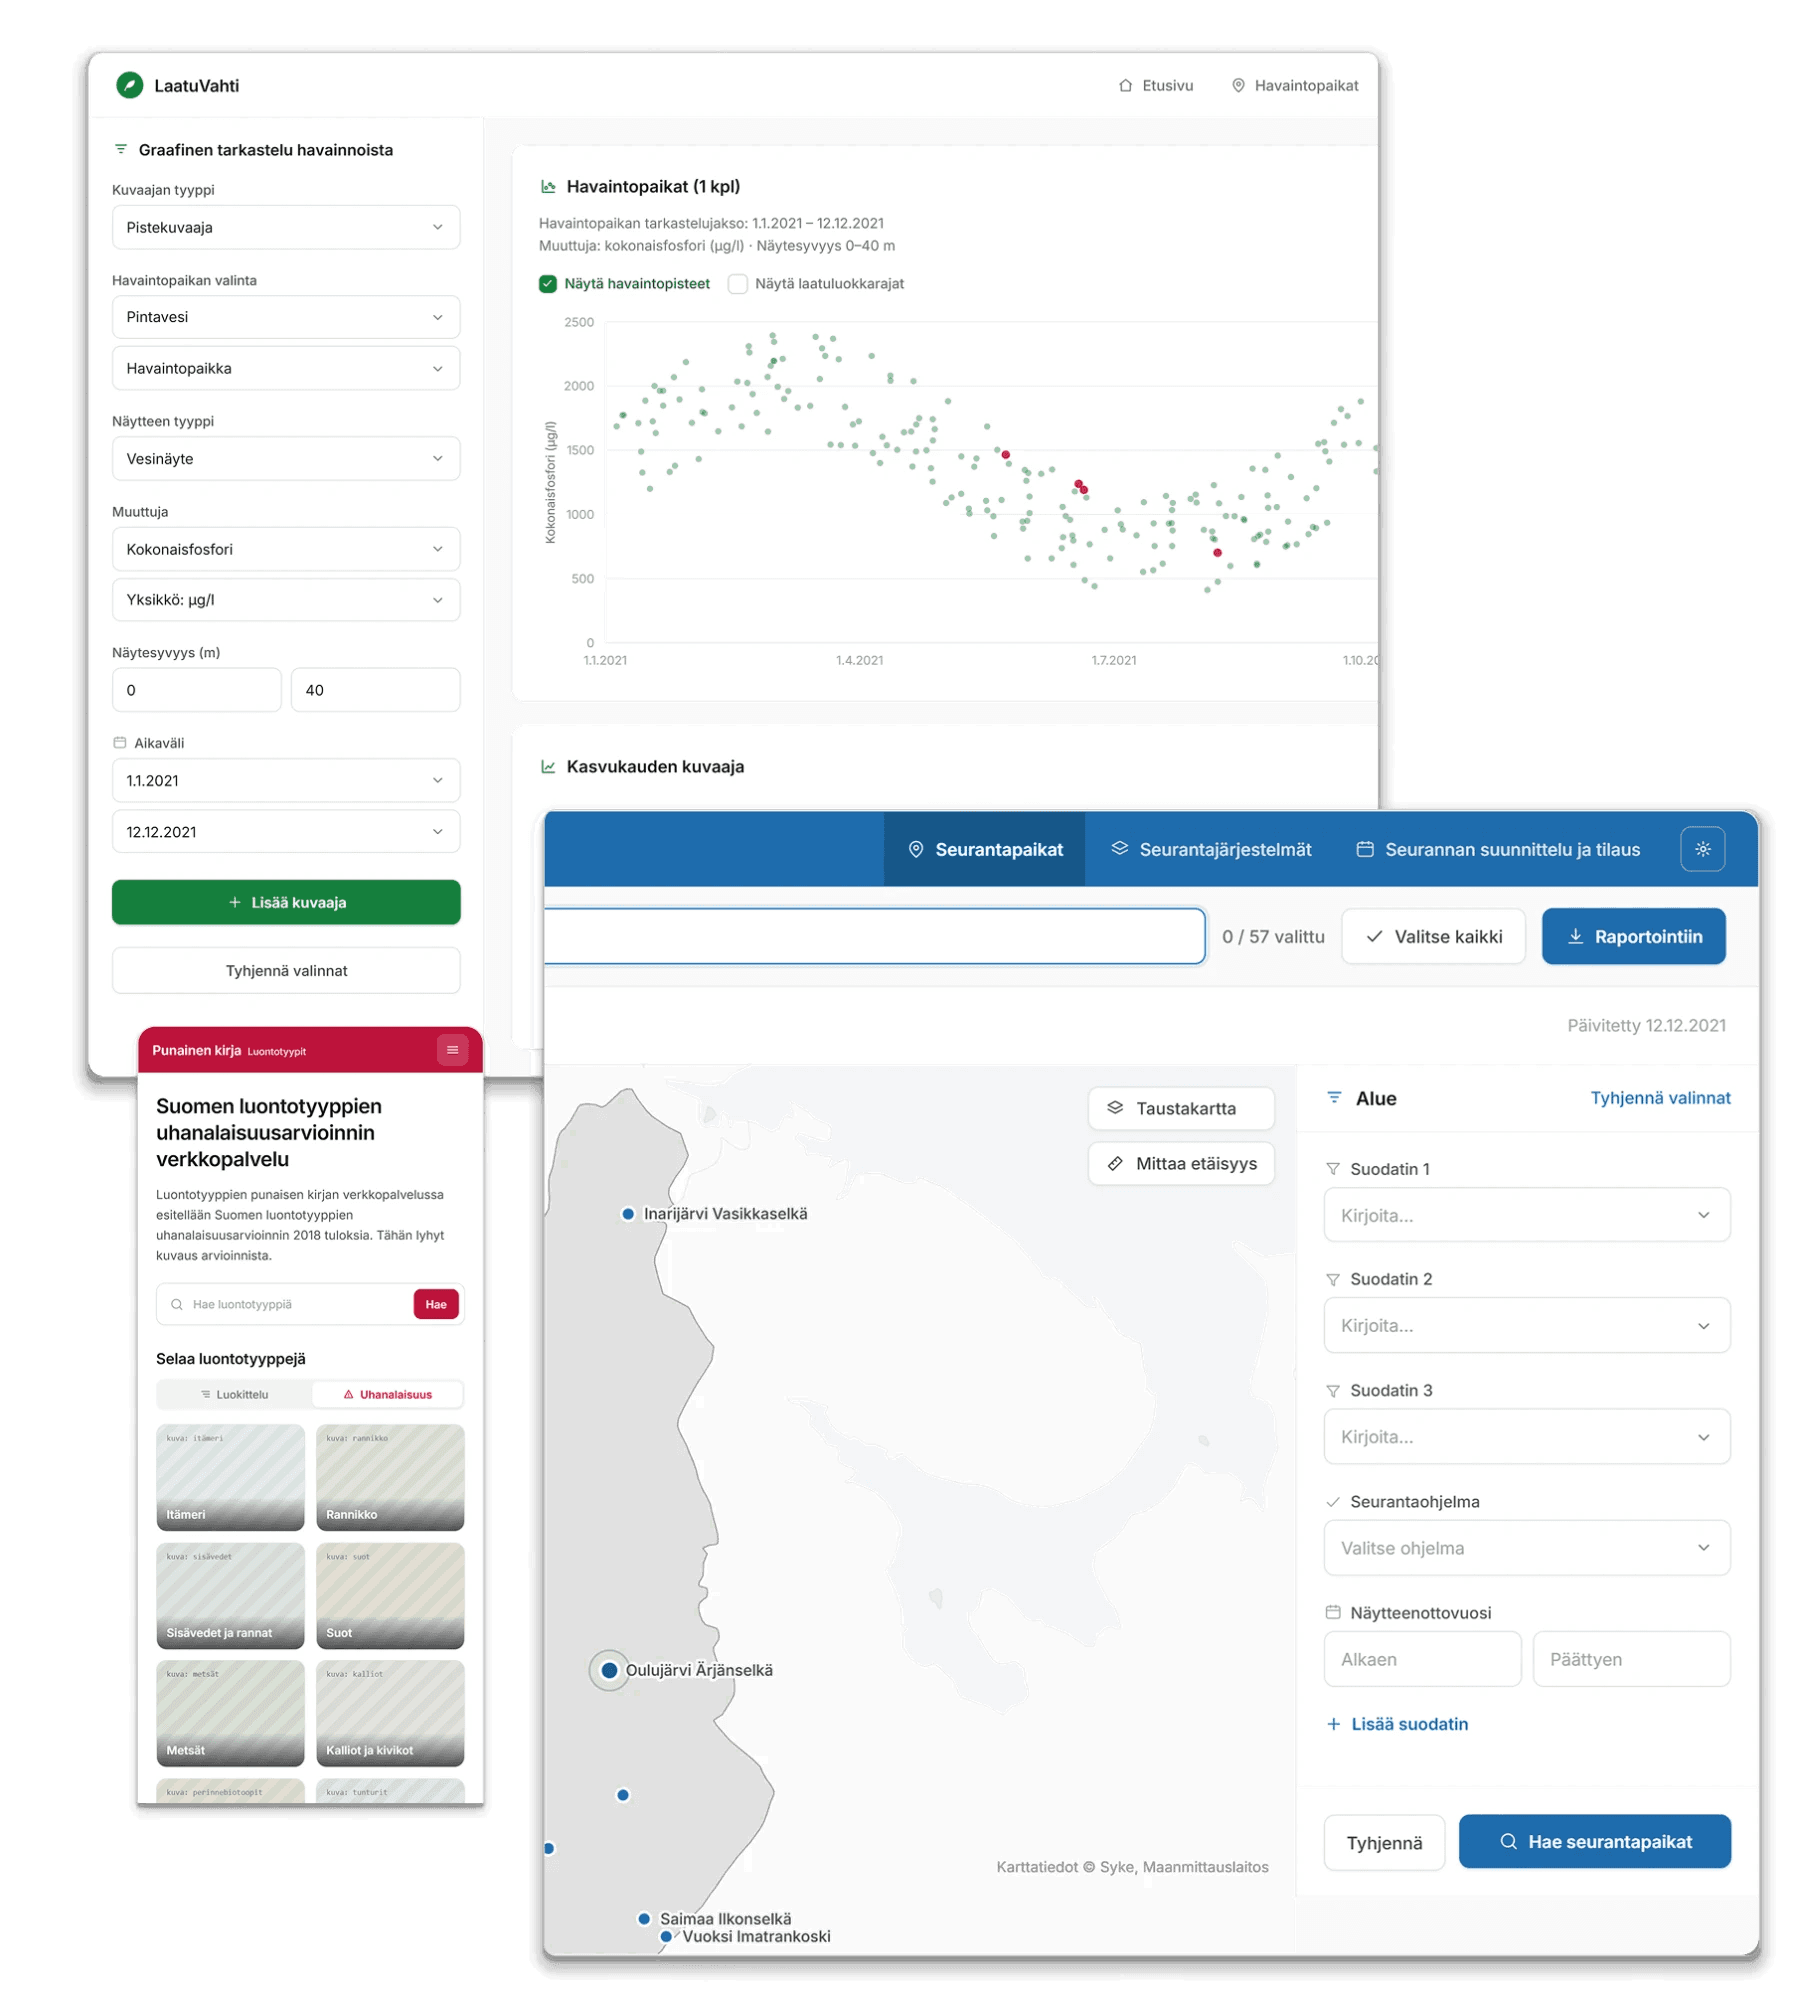 Environmental research
Transformed outdated systems into modern, efficient tools that help environmental researchers manage and analyze critical data.
View case study →