 Industrial
 Data & Expert Interface Design
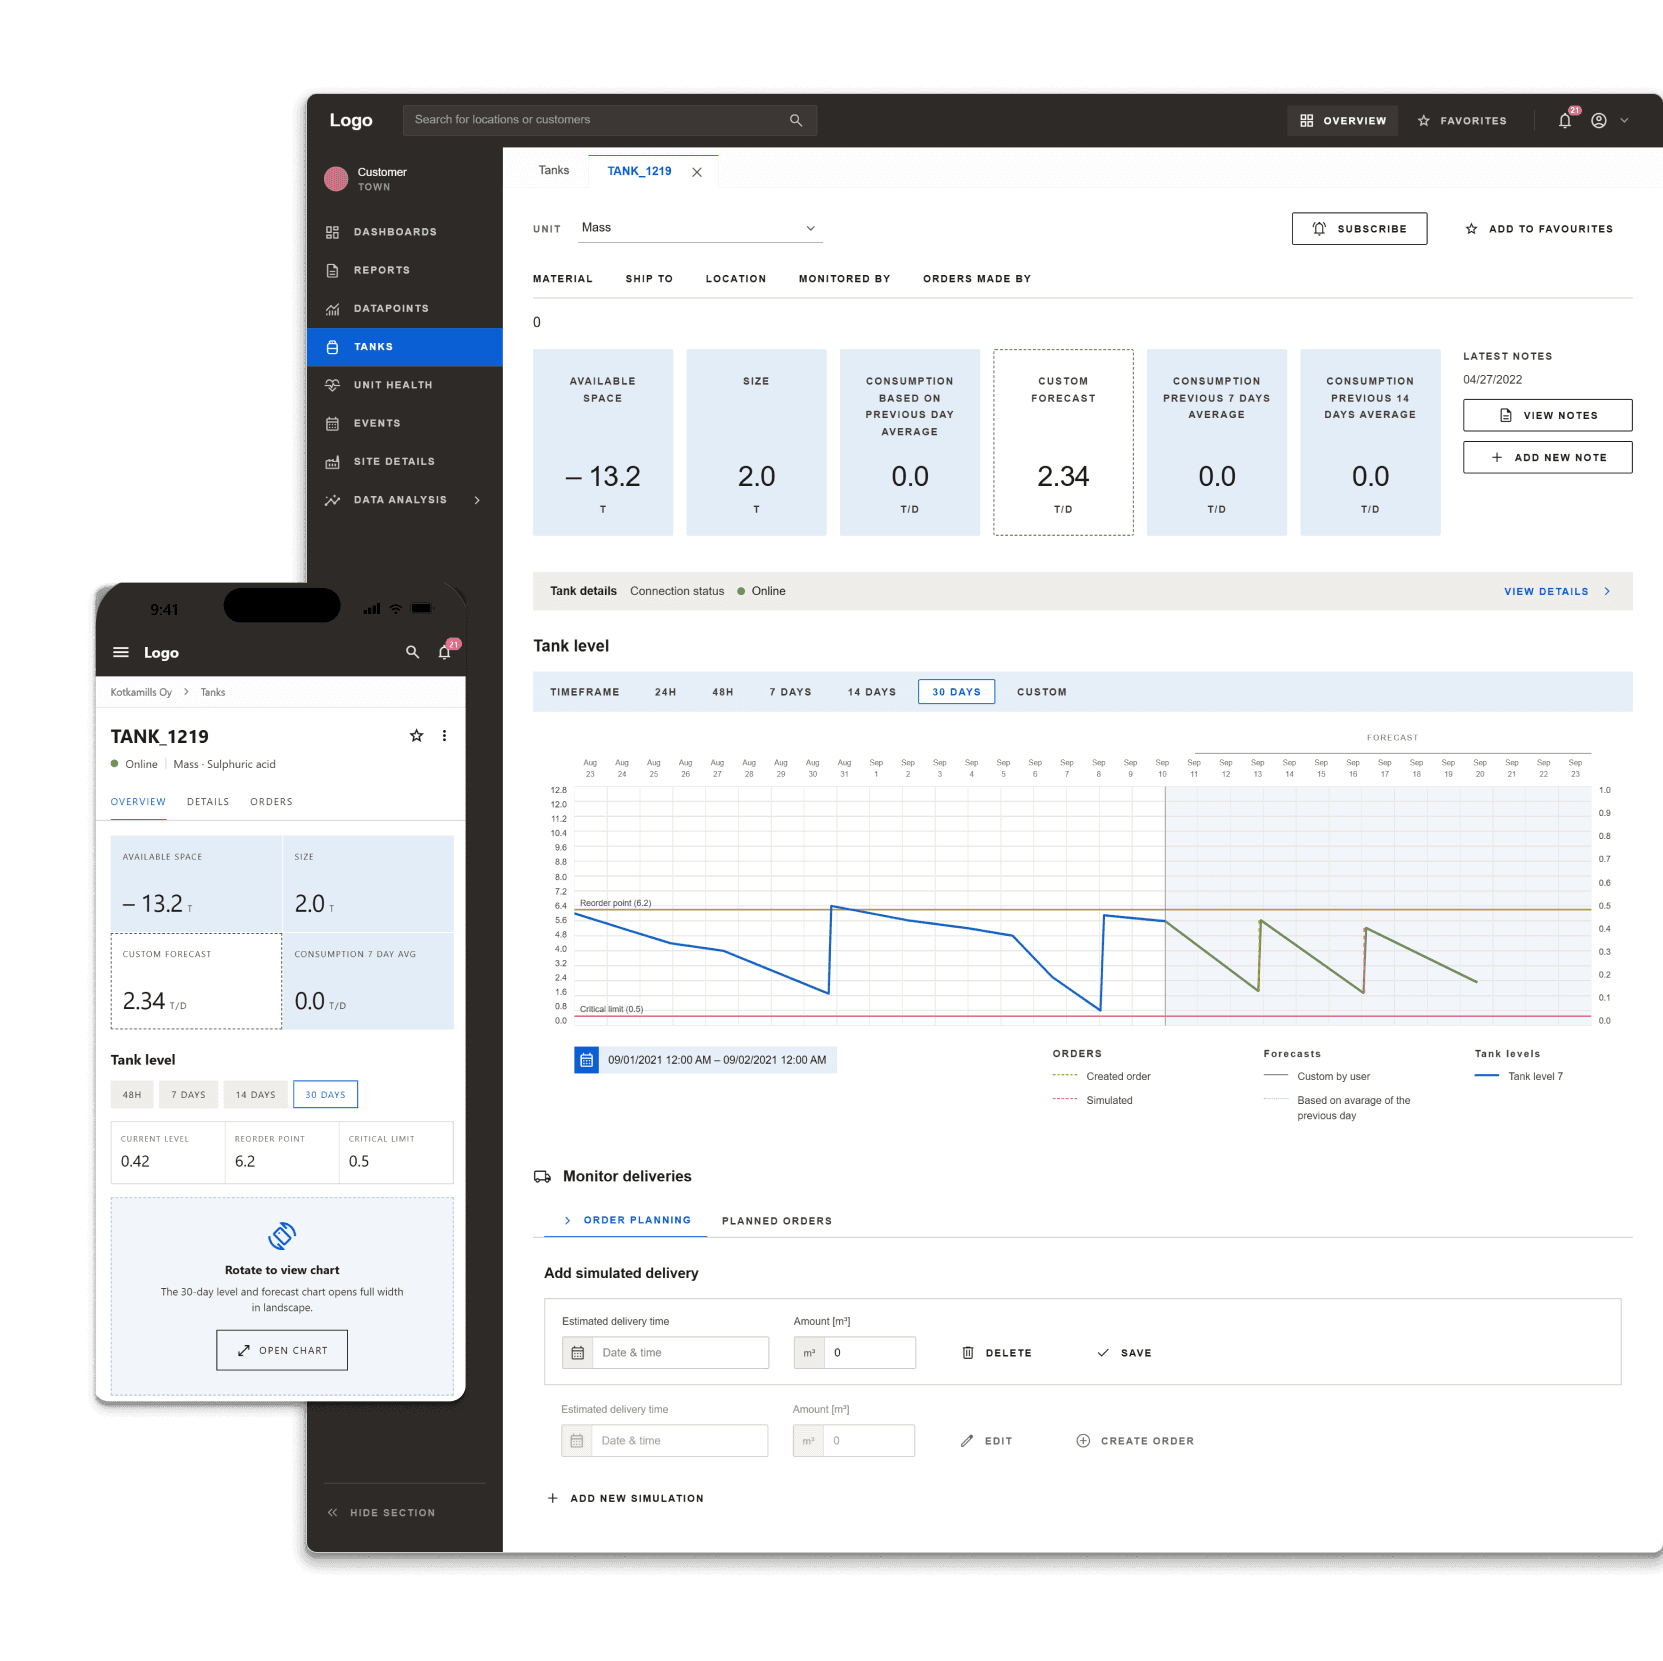
Built practical expert tools for industrial data workflows, making complex calculations and monitoring more reliable for specialists.
View case study →Case study · Modernization of Environmental Data Systems
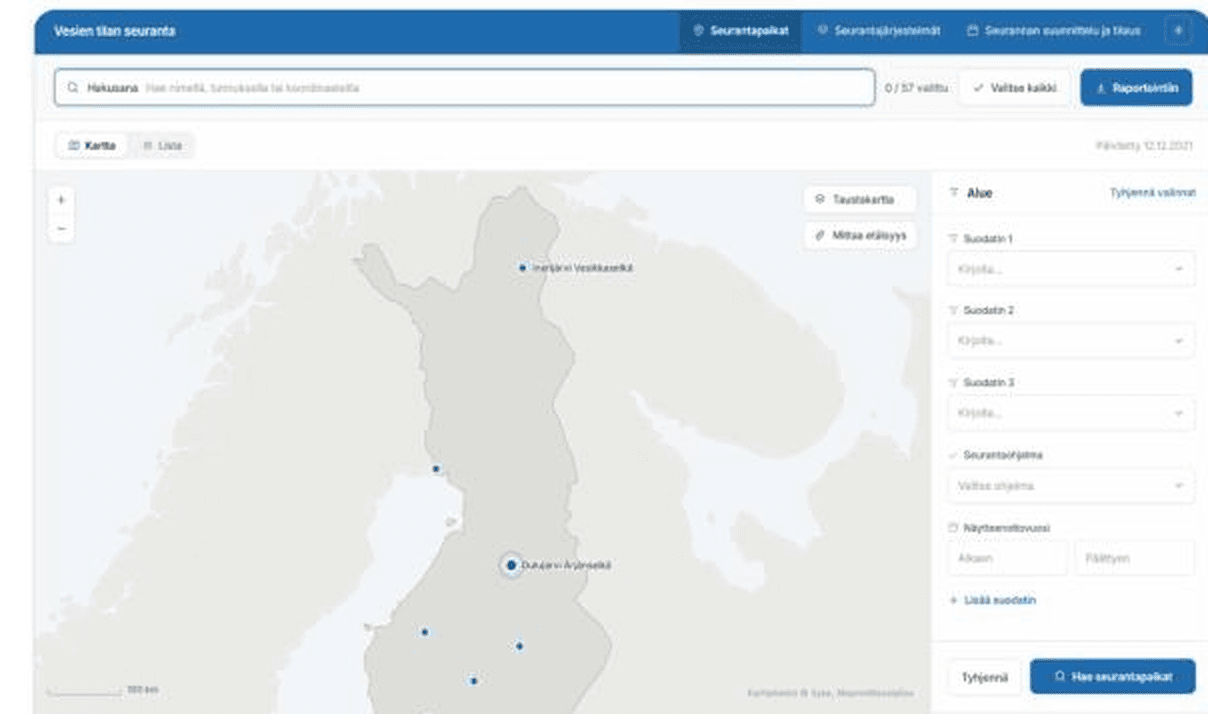
Data PlatformMonitoring and reporting tools for environmental data, built so specialists can find, compare and publish results without fighting the interface.
Role: UI/UX Designer (sole designer, long-term client relationship)
Focus: Modernizing outdated data systems, combining UX/UI design with lightweight service design
The brief
An environmental research institute relied on outdated tools to manage and analyze critical data, often defaulting to Excel just to make sense of it. Over several projects between 2020 and 2023, I was brought in as the institute's only UX designer to modernize these tools.
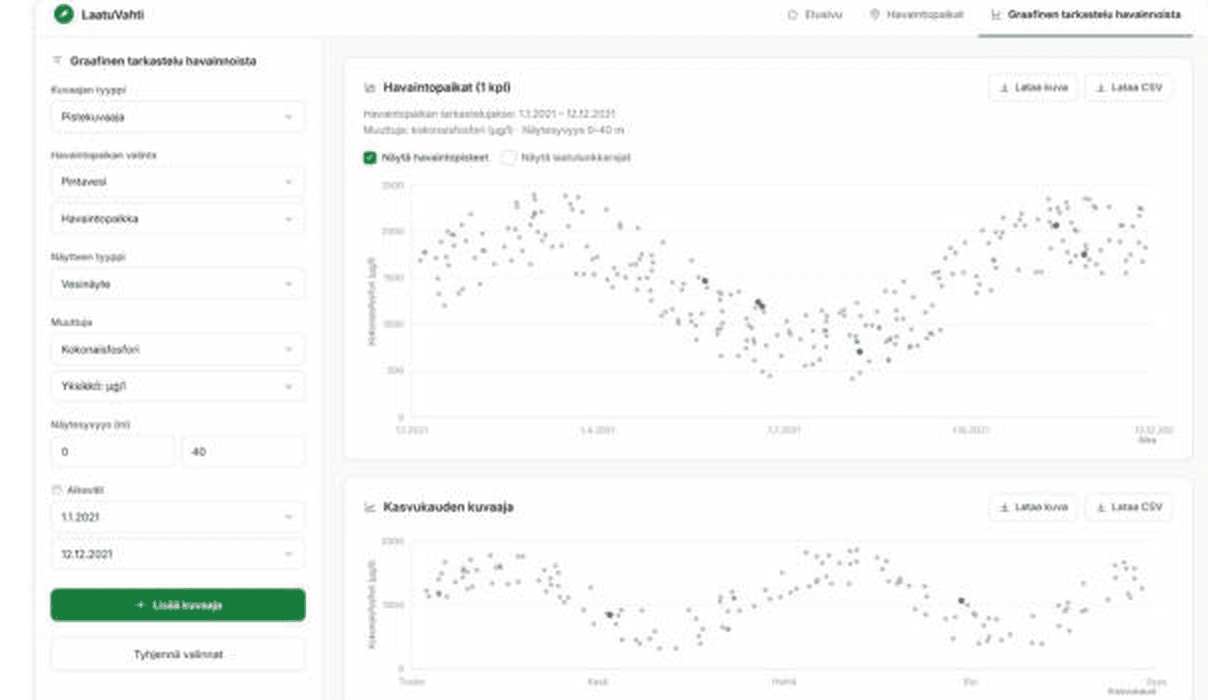
Selected screens
Desktop and mobile, one platform
Results
These impacts are based on feedback gathered directly from users during the projects.
Instead of just modernizing the look of old systems, we rebuilt several of them around how researchers actually work today, including how they combine map and table data, and how they add new results as their work continues.
In the largest of these projects, researchers had previously relied heavily on Excel to make sense of their data. We built proper analytics views directly into the system instead, giving them a much clearer, faster way to spot patterns and understand their data without exporting it elsewhere first.
The improved interfaces made everyday work noticeably easier for specialists. Saving new samples and tracking how they changed over time became much simpler than it was with the old systems.
Background
Every system I worked on was outdated and needed to be rebuilt, but rarely as an exact copy of the old one. In most cases, we could not simply recreate the old system with a new interface. We had to rethink how the data and workflows should actually work, then build something new on top of that. For a couple of the projects, this meant starting with a short round of research myself, close to what is called Lean Design: gather just enough to start, then learn the rest by building. I did that directly with the system's specialists to gather the material needed before I could start on the actual interface.
The hard parts
In hindsight
Keep reading
IndustrialBuilt practical expert tools for industrial data workflows, making complex calculations and monitoring more reliable for specialists.
View case study →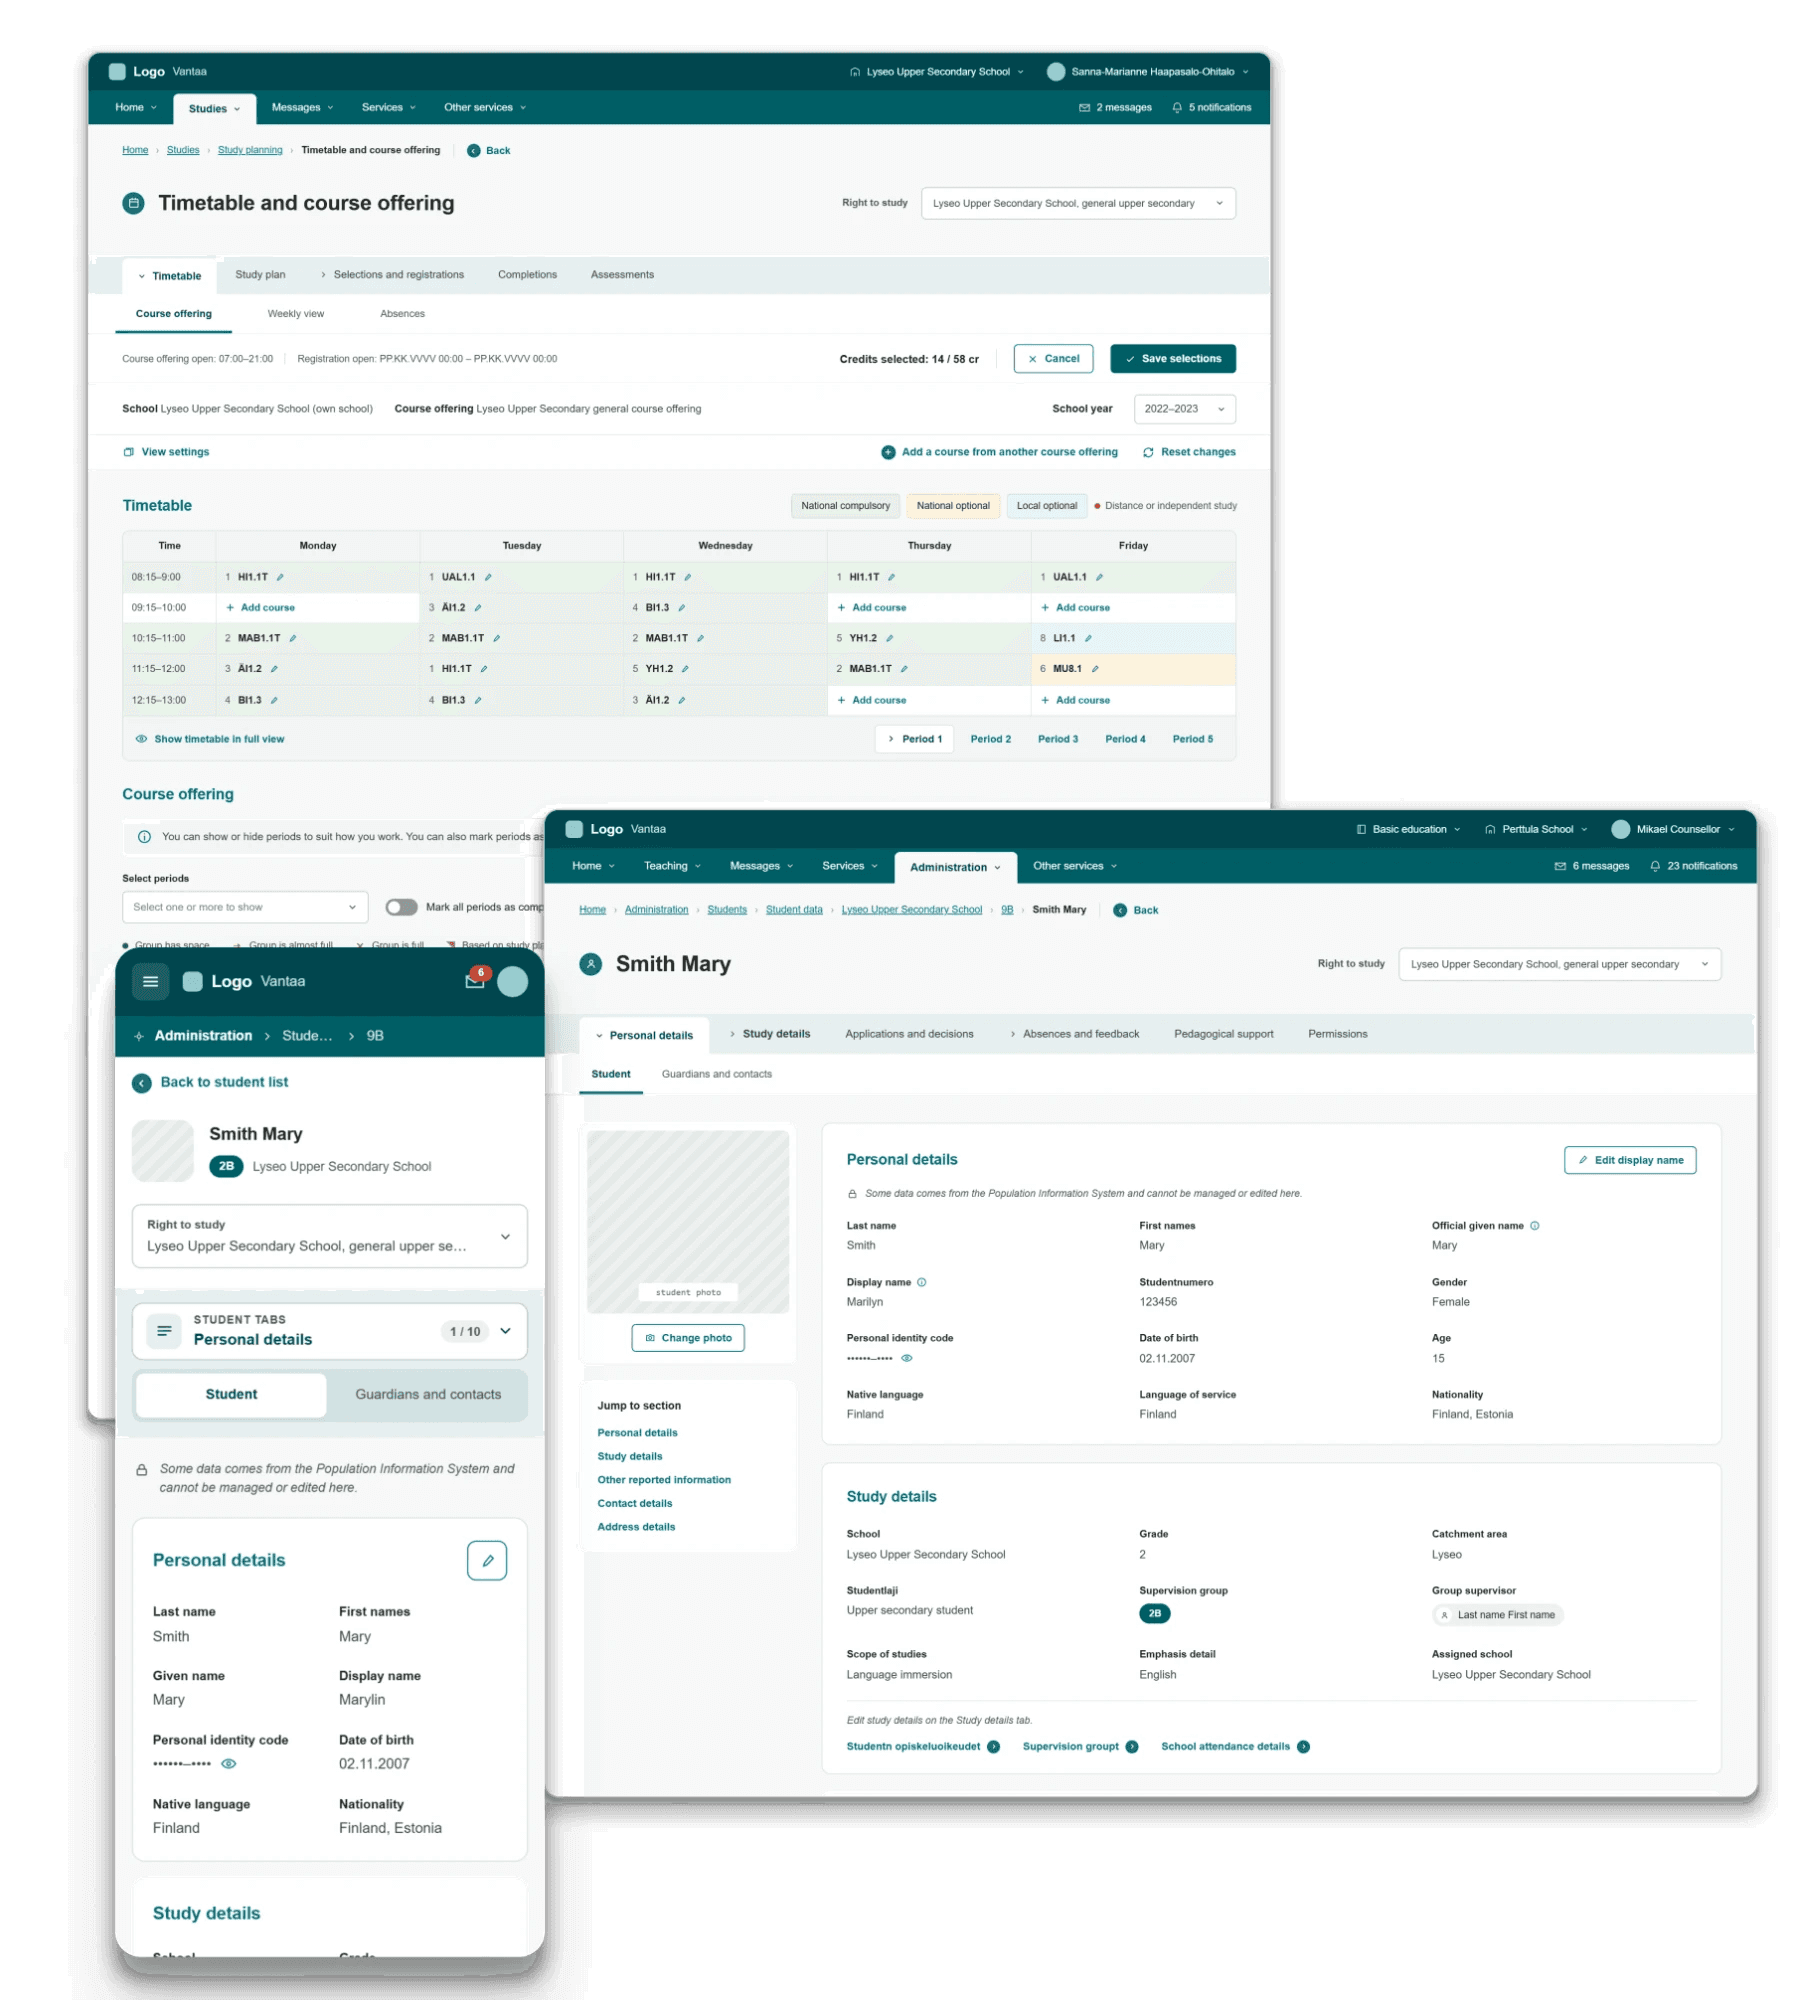 Public education
Brought structure to a massive public sector platform by uniting complex municipal school workflows into a clear, accessible tool for teachers and administrators.
View case study → Higher education
Designed a smarter search and service hub so students can find guidance and support without getting lost in fragmented systems.
View case study →